PostgreSQL 13 Benchmark: Memory Speed vs. TPS
Some people are obsessed with sports or cars. I follow computer hardware. The PC industry has overclocking instead of nitrous, plexi cases instead of chrome, and RGB lighting as its spinning wheels.
The core challenge I enjoy is cascading small improvements to see if I can move a bottleneck. The individual improvements are often just a few percent. Percentage gains can compound as you chain them together.
Today I'm changing the memory speed on my main test system, going from 2133MHz to 3200MHz, and measuring how that impacts PostgreSQL SELECT results. I'm seeing a 3% gain on this server, but as always with databases that's only on a narrow set of in-memory use cases. Preview:

Why more benchmarks?
The industry around PC gaming has countless performance tests at the micro and macro level. A question I took on this year is how to take some useful metrics or test approaches from PC benchmarking and apply them even to virtual database instances.
There was a big constraint: I could only use SQL. As much as I enjoy the
tinkering side of real hardware, a lot of the customers we support at Crunchy
Data are provided a virtual database instance instead of a dedicated server. For
PostgreSQL, I call these "Port 5432" installs, because the only access to the
server is a connection to the database's standard port number. Disk seek test?
You can't run fio or iozone on port 5432. Memory speed? There's no STREAM
or Aida on 5432. You can tunnel system calls through the PostgreSQL's many
server-side languages. That only goes so far when the software in each database
container is shrunk to a minimum viable installation.
The improvements I've put into pgbench-tools this year let me chug through an entire grid of client/size workloads, and my last blog went over upgrading to PostgreSQL 13 on this AMD Ryzen 9 3950X server. Part of what I'm doing here today is proving to myself the toolkit is good enough to measure a small gain, given that pgbench itself is not the most consistent benchmark.
Memory tweaking theory
On a lot of server installs tuning memory is something only the hardware vendor ever does. To respect that my initial PG13 comparisons left memory at its platform default speed: 2133MHz. The memory I'm using, G.SKILL F4-3600C19-16GVRB, can in theory run at 3600MHz.
Most desktop class motherboards have 4 RAM slots and run fastest when only two are used. Effectively this G.SKILL pair can bond into a dual-channel at 3600MHz. But the minute I try to fill all four slots, that speed is impossible. Performance doesn't scale up to quad channels; instead you get dual channels that are each split across two DIMMs. Juggling that adds just enough latency that the motherboard and CPU can't run at the maximum dual-channel speed anymore. Fully loaded with RAM, the best I can do on this hardware is running memory at 3200MHz. There's a similar but even worse trade-off buying big servers, as the buffering needed to handle very large amounts of RAM adds enough latency to pull down single core results.
Pounding a server with pgbench generates enough heat and random conditions that I rejected outright overclocking some years ago. I once lost my entire winter holiday chasing a once per day PG crash on my benchmark server, all from the CPU overheating just enough to flip one bit.
Quantifying speed improvements
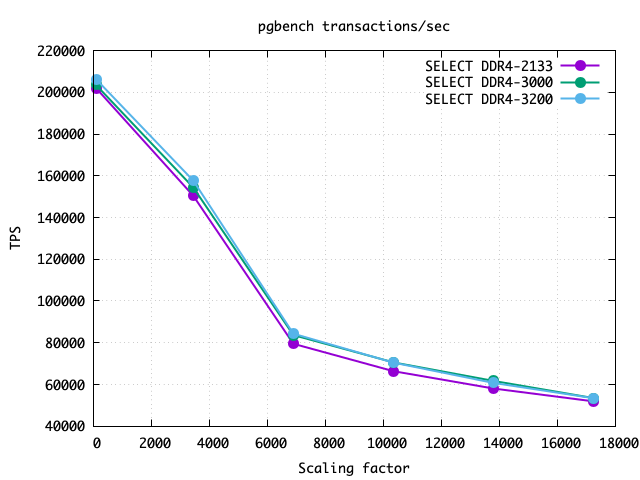
The graph above shows an even increase in speed across all the sizes tested (up to 256GB=4X RAM), which is a nice start. Looking instead at the client count gives a different pattern:

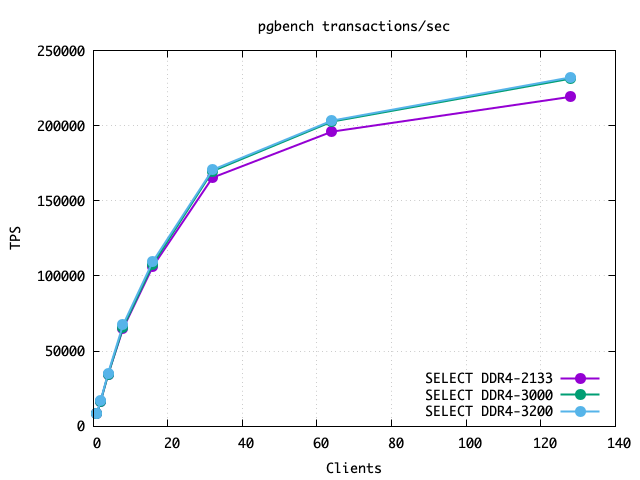
There is a clear trend that high client counts are getting more of a boost from the faster memory than low ones. That is exactly what you'd expect and hope for. More clients means more pressure to move memory around, and anything you can do to accelerate that helps proportionately.
pgbench-tools puts all the results in a database, so I can write simple SQL to
analyze the workload grid:
SELECT set,clients,ROUND(AVG(tps)) FROM test_stats WHERE set>10
GROUP BY set,clients ORDER BY set,clients
\crosstabview
| clients | 1 | 2 | 4 | 8 | 16 | 32 | 64 | 128 |
|---|---|---|---|---|---|---|---|---|
| 2133 | 8354 | 16508 | 34366 | 64859 | 106305 | 165437 | 196002 | 219186 |
| 3000 | 8293 | 16574 | 34267 | 65612 | 107867 | 169757 | 202697 | 231303 |
| 3200 | 8459 | 16954 | 35221 | 67392 | 109688 | 170635 | 203348 | 232132 |
To make these examples cleaner, in the first column I replaced the set identifier number with the actual speed in MHz. The 128 client results are notably better. At 1 client the run to run variation noise was bigger than the regression, showing the bizarre result that 3000MHz memory worked slower than 2133MHz. I can make problems like that go away by running a lot more tests until the averages settle down; that didn't seem necessary here. I have a follow-up article coming where I dig into single client speeds more carefully.
I also like to look at the maximum rate any test runs at. Averages can hide changes to a distribution . You can't fake legitimately running faster than ever before. Considering only the best out of the runs that fit into each summary cell, which normally is the scale=100 1.6GB result, gives:
SELECT set,clients,max(tps) FROM test_stats WHERE set>10
GROUP BY set,clients ORDER BY set,clients
\crosstabview
| clients | 1 | 2 | 4 | 8 | 16 | 32 | 64 | 128 |
|---|---|---|---|---|---|---|---|---|
| 2133 | 22319 | 41535 | 81216 | 149678 | 233058 | 377269 | 347553 | 367855 |
| 3000 | 22361 | 42217 | 83650 | 153980 | 234985 | 379450 | 348910 | 369827 |
| 3200 | 23213 | 42806 | 84694 | 157181 | 237486 | 386854 | 352344 | 375003 |
Re-scaling to percentages and eliminating the 3000MHz middle step:
| 2133-3200 | 1 | 2 | 4 | 8 | 16 | 32 | 64 | 128 | Median |
|---|---|---|---|---|---|---|---|---|---|
| Avg TPS | +1.3% | +2.7% | +2.5% | +3.9% | +3.2% | +3.1% | +3.7% | +5.9% | +3.2% |
| Max TPS | +4.0% | +3.1% | +4.3% | +5.0% | +1.9% | +2.5% | +1.4% | +1.9% | +2.8% |
Since increasing memory speed gives a 2.8-3.2% gain overall depending on how you slice the results, I'm happy to call that a solid 3% gain across the grid. Light client counts gain the least, with a low at 1 client of only a 1.3% average gain. When overloaded with a full 128 clients, average throughput increased by up to 5.9%.
If you'd like to read another perspective on this topic, Puget Systems has a nice article on CPU Performance: AMD Ryzen 9 3950X. They find a similarly sized gain to what I measured here, and their commentary about larger memory capacity is in line with my comments above.
